HOW ARE CUSTOMERS REALLY BEHAVING?
Six months in independent restaurants. The numbers, the take-aways and the actions we can take to ensure survival.
The last six months have felt fairly brutal for operators across the whole hospitality sector but, with fewer economies of scale or financial cushions, the independent sector has arguably been the hardest hit. We speak about this a lot at Countertalk, but our conversation is often anecdotal – and while this still holds significant weight through the calibre of contributors and the breadth of resonance, without checking the data this can be dismissed as limited or individual experience. So what does the broad environment really look like, right now and in the context of the last six months?
Our friends at Viewpoint Accountants specialise in the London independent restaurant sector, with clients across the city. That means they’re in the position to give more than just anecdotal evidence, using their clients’ numbers to gain a data-driven overview of what the sector looks like right now, what its experience has looked like for the last six months and, crucially, how restaurateurs can interpret the data to inform their focuses and actions for the next six months and beyond.
The surprising results? Footfall and turnover is actually UP on previous years. But this might not be the solve-all good news we might hope when taken against spend per head. We put this analysis to Jay Patel of independent Italian restaurant Legare who emphasised that top-line revenue means nothing if your operating expenses are out of control. He has provided some fascinating insight into the steps he takes to increase revenue in his own establishment, which should provide excellent, detailed inspiration for others wishing to do the same.
Viewpoint Cohort Insights Jan-June 2023
The data presented here is the anonymised, aggregated data from 45 businesses, all Viewpoint clients, over six months. Each company has consented for us to share this in order to form some general insights about business in the independent hospitality sector so far in 2023.
Most encouragingly, we can see from the below chart that sales have increased month on month since January, with the exception of May – which had an extra Bank Holiday for the Coronation, and exceptionally wet weather.
The stacked column graph above shows the average total sales for each month, excluding outliers. The columns are split by food and drink sales, showing the proportion each comprise of total sales by month.
Despite being in a cost of living crisis, the chart above demonstrates that covers have also increased month on month. Crucially, as shown below, there is a positive correlation between number of covers and total sales.
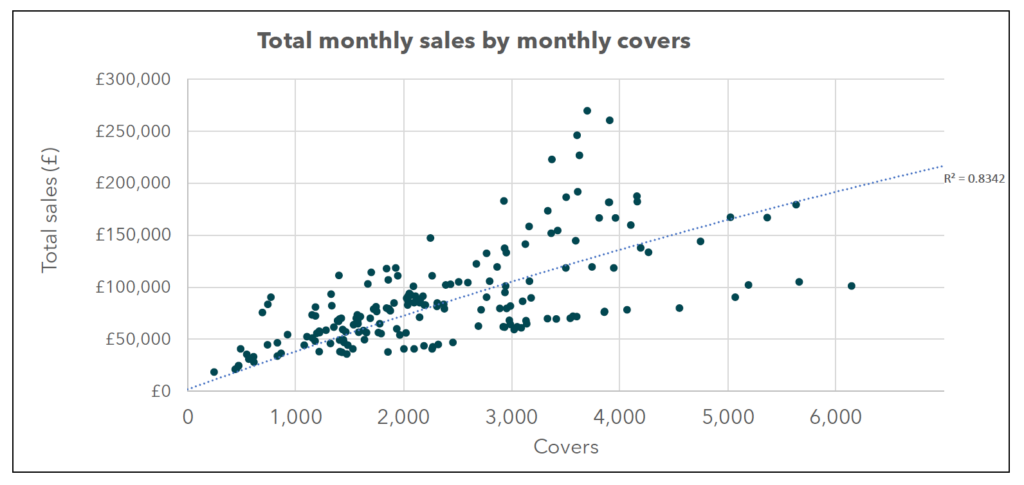
The scatter plot above shows monthly total sales by monthly covers. As the number of covers increase so do total sales, though not in a strictly linear fashion. Sales peak when monthly covers are above 3,000 but below 4,000, after which point they tend to decrease again.
There is also however, a negative correlation between number of covers and spend per head. Spend per head in general has also been on a downward trajectory, plateauing between May and June. This could be because whilst the cost of living crisis hasn’t dimmed the appetite for eating out, it has led to diners setting a hard budget on what they will spend when they do. This would suggest that restaurateurs would do better to encourage repeat business and turn tables smartly, rather than keep pushing for higher spends per head.
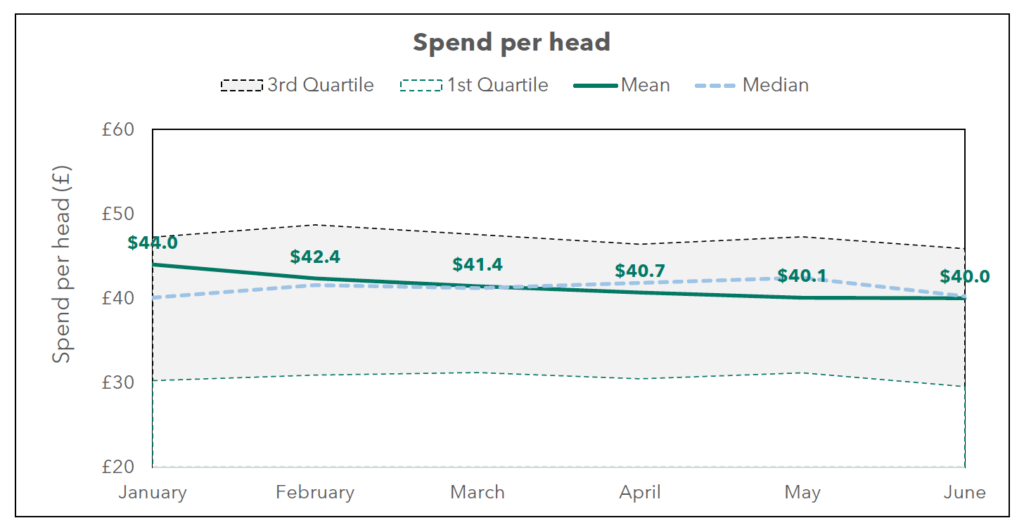
The graph above shows the mean and median spend per head by month. The shaded area shows the area between the 1st and 3rd Quartiles, constituting 50% of the monthly spend per heads across the cohort.
The summer months also often means the opening of terraces and al fresco drinking and dining for places with these options. Drinks-only customers often reduce the average spend per head, but the turns might be quicker in beer gardens and the like.
The highest spend per head and lowest covers were in January, perhaps suggesting that those who do want to go out in this typically abstemious month, would rather be tempted by exciting, fun food and drink offerings rather than cut price promotions.
We have seen from our cohort sales figures that compared to last year, spend per head has increased by 11%, which is in line with inflation. Demand is also up and there’s 30% higher turnover this year than last.
Based on this data, Viewpoint recommends:
- The data indicates that a focus on maximising covers is the best strategy to increasing revenue.
- January’s data of low covers and higher spend per head might suggest that focusing on enticing offerings rather than cut price promotions might be a better idea for the new year.
What is not shown:
- Together, the turnover and covers figures all sound fairly positive until we consider what the data here does not show.
- We know that operating costs are up across the board, from energy, to labour, to rent, making it more difficult to maintain the same levels of profit as in 2022, even with higher turnover.
- It is difficult for us to map this, because labour costs are worked out differently per organisation, stocktakes done at different times, and payments to directors, head office staff all vary.
- This being said, it’s a fair assumption from looking at the data we do have, and observing the rising costs all around us, that independent restaurants are currently running to stand still.
- The hope is that with all the efficiencies created this year, as the cost-of-living crisis eases hopefully next year, that independent hospitality businesses will be in a good place to make some great strides.
THE RESPONSE
What is one independent restaurant doing to ensure survival in the current climate?
From Jay Patel, co-owner of Legare
The analysis from Viewpoint accountants is correct, as increasing covers and increasing spend-per-head on those covers are the two primary levers you can push and pull to increase top line revenue. That being said, those are also the obvious things that every restaurant surely aims for. At Legare we’re limited by what we can do in a 35 cover, 680 sq/ft restaurant, so we need to maximise what we have. We’ve implemented a few things which have helped, these being;
Pre theatre menu
This means at 6pm-7pm the restaurant is full of quick 1hr diners spending £30-£35 per head on food (wine and service not included) on low cost items (our pre theatre menu is a portion of focaccia for the table, a primi of pasta or risotto, and a dessert.) The menu is designed for speed, and value, as well as maximising early bookings which would otherwise be quieter periods. Most customers usually order a glass or two of wine or an additional a la carte option bringing their spend per head to £50 per person, which really helps. We are then able to squeeze in further bookings (and walk ins where possible) before the second busier seatings at 8/8:30pm.
Portion control
Menu psychology and structure is important. We don’t want people filling up on focaccia, antipasti, or pasta. We always aim to get at least one dessert on the table to finish a meal. We’ve decreased the size of certain pasta portions so they aren’t overly filling. We’ve paired back on bready courses, and have lighter, protein and veg led antipasti to leave space for carb-heavy primi and secondi dishes. As mentioned we always aim to get a cannoli on every table if we can, as it’s an easy additional £6.
Wine list
We have structured our wine list with slightly larger gaps between pricing so people commit to a lower or higher priced bottle. Eg. We previously had a list with £30, £33, £35, £39, £43 where as now we have £30, £38, £44 etc. We’ve cut down on the number of bottles, but made our offering more premium and more exciting – which does two things. Firstly it’s not as daunting for a customer to navigate as there are fewer wines to choose from (but better quality imo). Secondly it forces them to commit to a wine which costs £6-£10 more. If they don’t, that’s fine, we see it as an opportunity to sell two of the cheaper bottles to them. Two £30 house wines are more profitable to us than one £60 looking at cost to sales ratios.
Events
Getting commitment for full venue buy outs / hires means a far stronger GP with set menus, less wastage and less staffing. Everyone’s happy. Customers have their own space, we make more money with less outgoings, and we have financial commitment ahead of time.